Metrics with Prometheus
Metrics in Fission
Fission exposes Prometheus-format metrics from every component and function pod, which a Prometheus server scrapes and Grafana visualizes. These metrics let you monitor the health of both your functions and the Fission components themselves — call counts, error rates, cold starts, and request overhead.
Prometheus
Prometheus is a monitoring and alerting tool. It uses a multi-dimensional data model with time series data identified by metric name and key/value pairs.
Fission exposes metrics that Prometheus scrapes at regular intervals.
Grafana
Grafana is a visualization tool which can query, visualize, alert on and understand metrics. It supports Prometheus as its data source.
Setting up
There are different ways to install Prometheus. It can run in or outside containers. Since Fission itself runs in Kubernetes, we’ll use the Prometheus Operator, which installs Prometheus as a Kubernetes Custom Resource.
Prerequisites
- Kubernetes cluster
- Fission installed in the cluster
- Helm (This post assumes helm 3 in use)
- kubectl and kubeconfig configured
Install Prometheus and Grafana
This step will install a new Prometheus and Grafana setup using the kube-prometheus-stack Helm chart. If you want to import Fission metrics into your existing setup, you can skip this step and go to the next one: Enabling Prometheus Service Monitors and Grafana Dashboards in Fission
We’ll install Prometheus and Grafana in a namespace named monitoring.
To create the namespace, run the following command in a terminal:
export METRICS_NAMESPACE=monitoring
kubectl create namespace $METRICS_NAMESPACE
Install Prometheus and Grafana with the release name prometheus.
helm repo add prometheus-community https://prometheus-community.github.io/helm-charts
helm repo update
helm install prometheus prometheus-community/kube-prometheus-stack -n monitoring
This will install Prometheus and Grafana in the monitoring namespace.
Along with the Prometheus server, it’ll also install other components viz. node-exporter, kube-state-metrics and alertmanager.
Enabling Prometheus Service Monitors and Grafana Dashboards in Fission
You’ll need to enable service monitors which will scrape metrics from Fission components. You can also import example dashboards provided by the fission chart.
Save the following yaml file as values.yaml or add these lines to your existing custom values.yaml
Note: For an existing Prometheus setup, change the namespace and additional labels based on the namespace and release name of your kube-prometheus-stack chart respectively.
serviceMonitor:
  enabled: true
  namespace: "monitoring"
  additionalServiceMonitorLabels:
    release: "prometheus"
podMonitor:
  enabled: true
  namespace: "monitoring"
  additionalPodMonitorLabels:
    release: "prometheus"
grafana:
  namespace: "monitoring"
  dashboards:
    enable: true
Apply it with a Helm upgrade:
helm upgrade fission fission-charts/fission-all --namespace fission -f values.yaml
Accessing Grafana UI
The installation creates a Service named prometheus-grafana. To access this, you can use Kubernetes port forwarding
kubectl --namespace monitoring port-forward svc/prometheus-grafana 3000:80
Grafana dashboard can be now accessed on http://localhost:3000.
To log in to the Grafana dashboard, enter admin in the username field.
For password, you’ll need to run the following command:
kubectl get secret --namespace monitoring prometheus-grafana -o jsonpath="{.data.admin-password}" | base64 --decode ; echo
This installation also adds Prometheus as a data source for Grafana automatically.
You can verify and update this in the Data Sources section of the UI.
Metrics Queries
Once Prometheus is configured, we can now run queries in Grafana over Fission metrics.
Individual queries can be run under Explore section.
Fission exposes a set of metrics. For example to query the total number of function calls, run
fission_function_calls_total
Calls for a specific function can be queried using
fission_function_calls_total{name="foo"}
To track the router-side overhead Fission adds to a specific function
fission_function_overhead_seconds{name="hello"}
There are a few more Fission metrics available which are listed in Metrics Reference.
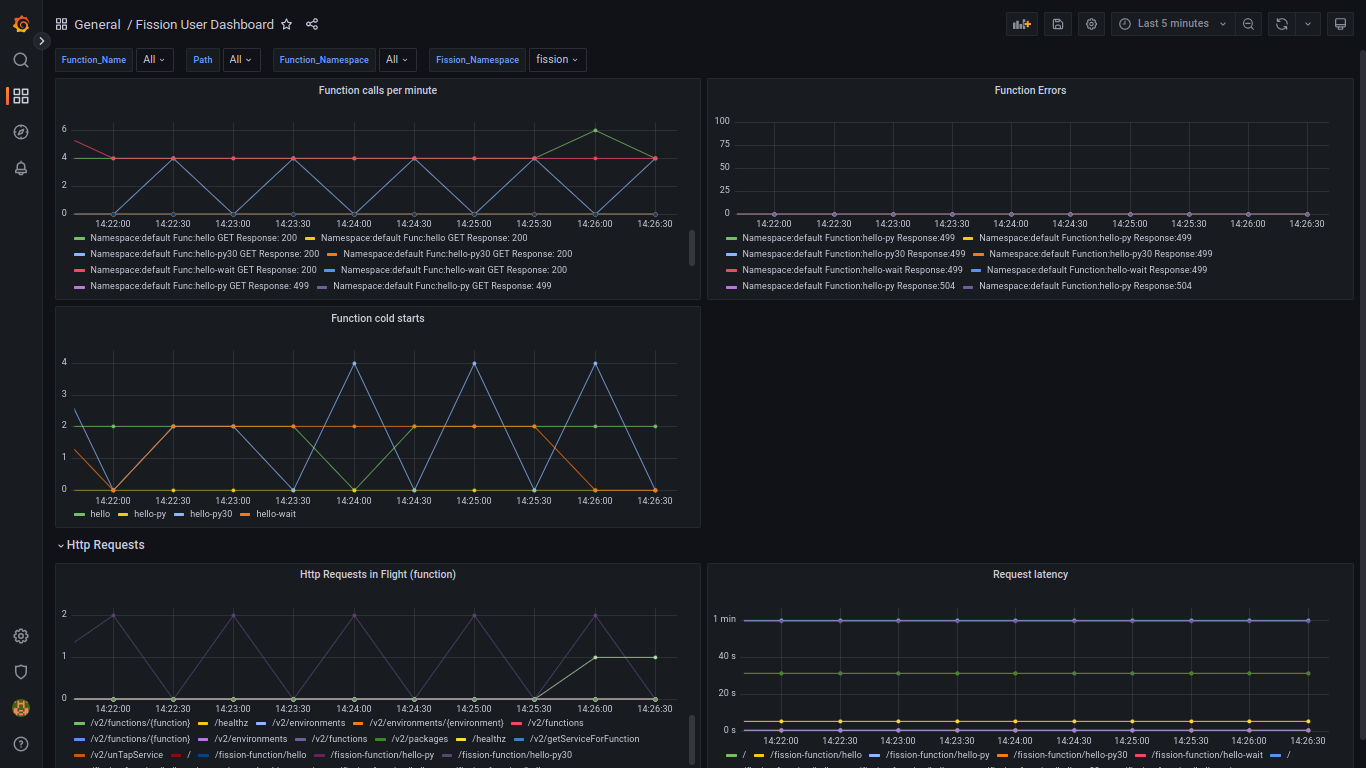
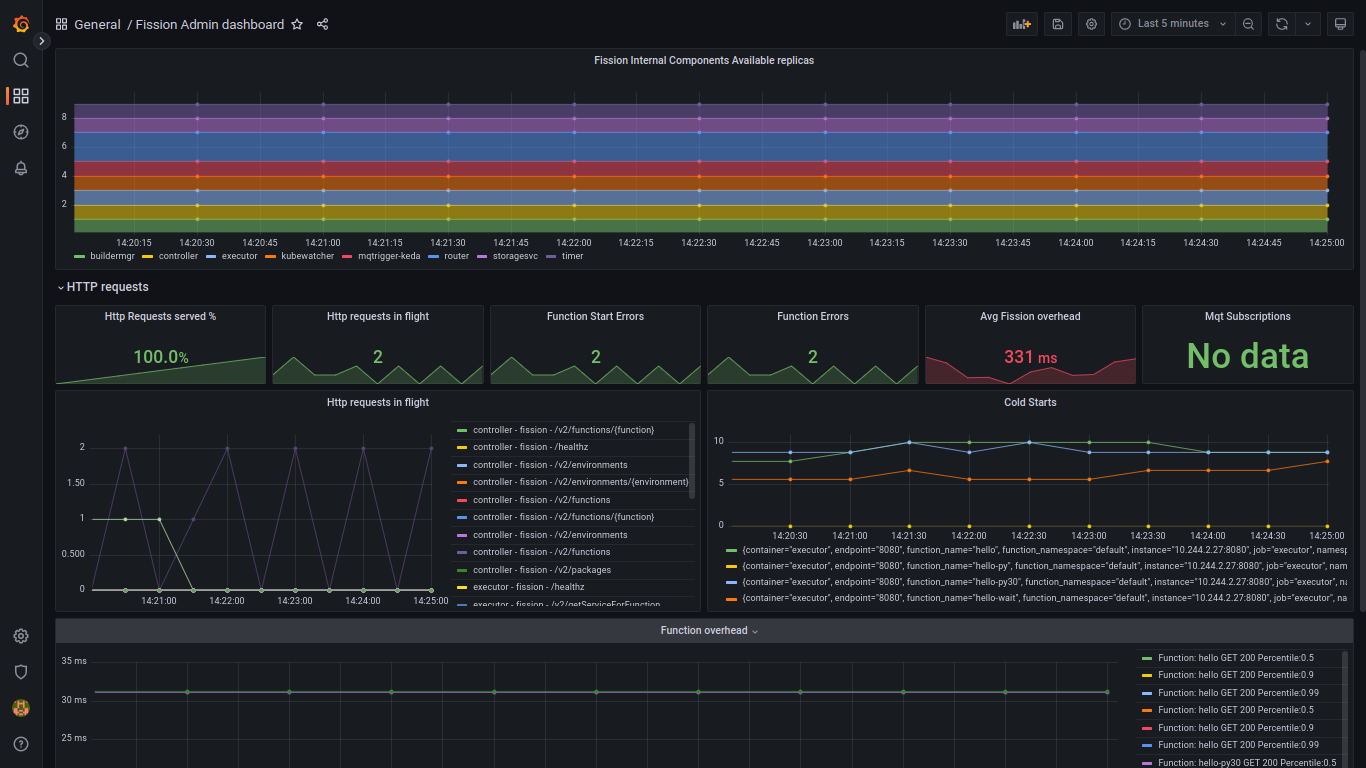
Fission Dashboard
With Grafana, visual dashboards can be created to monitor multiple metrics in an organized way.
You can refer to the two dashboards in the Fission Helm chart Fission user dashboard and Fission admin dashboard that show metrics from all the major components of Fission.
Once imported with the earlier step Enabling Prometheus Service Monitors and Grafana Dashboards in Fission, the dashboards will look similar to images below.
View the list of all Fission dashboards posted over time.