Logs with Loki
Logs in Fission
Both Fission’s core services and your function pods emit logs, and aggregating them makes debugging far easier.
Fission runs several core components that route, build, and execute your functions. The logs from the components and from the function pods together tell the full story of a request, so a good log-aggregation backend is worth setting up.
Grafana Loki
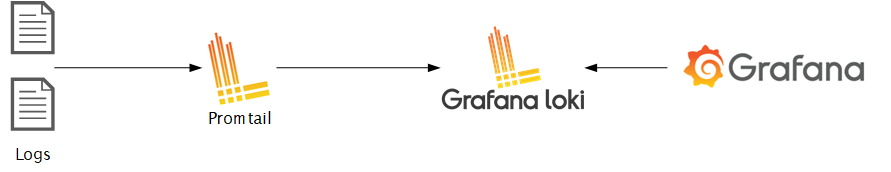
Loki is a horizontally-scalable, highly-available, multi-tenant log aggregation system inspired by Prometheus. The main components are a client to fetch the logs, an aggregator, and a visualizing tool (Grafana).
The stack supports multiple clients, for the case here we will use Promtail which is the recommended client when using the stack in Kubernetes. Here is a quick overview of components that make up the Loki platform:
- Loki - Loki is a horizontally scalable, highly available, multi-tenant log aggregation system inspired by Prometheus.
- Promtail - Promtail is the client which fetches and forwards the logs to Loki. It is a good fit for Kubernetes as it automatically fetches metadata such as pod labels.
- Grafana - A visualization tool that supports Loki as a data source.
The stack is depicted briefly in the below image
Setting up
There are different ways and configurations to install the complete stack. For this case, we’ll use Helm.
Prerequisite
- Kubernetes cluster
- Fission installed in the cluster
- Helm (This post assumes helm 3 in use)
- kubectl and kubeconfig configured
Install Grafana and Loki
Create a values.yaml file. We are installing monolithic Loki. Check Loki’s deployment modes.
cat > loki-config.yaml <<EOF
deploymentMode: SingleBinary
loki:
  auth_enabled: false
  commonConfig:
    replication_factor: 1
  storage:
    type: 'filesystem'
  schemaConfig:
    configs:
    - from: "2024-01-01"
      store: tsdb
      index:
        prefix: loki_index_
        period: 24h
      object_store: filesystem # we're storing on filesystem, so there's no real persistence here.
      schema: v13
singleBinary:
  replicas: 1
read:
  replicas: 0
backend:
  replicas: 0
write:
  replicas: 0
EOF
From a terminal, run the following commands to add the Loki repo and then install Loki.
$ helm repo add grafana https://grafana.github.io/helm-charts
$ helm repo update
$ helm upgrade -n monitoring --create-namespace --install loki grafana/loki -f loki-config.yaml
This will install Loki in the monitoring namespace. Check if there’re pods running for Loki.
Install Promtail
You’ll notice that the Promtail installation is disabled above. This is because custom configuration is required to effectively tail logs. The default Promtail configuration follow the kubernetes recommended labels and filter out everything that doesn’t conform to those rules.
Create a values.yaml file. This configuration will allow Promtail to tail and forward all labels. This is a necessity since fission adds additional labels when a pod is specialized.
cat > promtail-config.yaml <<EOF
config:
  clients:
    - url: http://loki-gateway.monitoring.svc.cluster.local/loki/api/v1/push
  extraRelabelConfigs:
      - action: labelmap
        regex: __meta_kubernetes_pod_label_(.+)
  snippets:
    common:
      - action: replace
        source_labels:
          - __meta_kubernetes_pod_node_name
        target_label: node_name
      - action: replace
        source_labels:
          - __meta_kubernetes_namespace
        target_label: namespace
      - action: replace
        replacement: \$1
        separator: /
        source_labels:
          - namespace
          - app
        target_label: job
      - action: replace
        source_labels:
          - __meta_kubernetes_pod_name
        target_label: pod
      - action: replace
        source_labels:
          - __meta_kubernetes_pod_container_name
        target_label: container
      - action: replace
        replacement: /var/log/pods/*\$1/*.log
        separator: /
        source_labels:
          - __meta_kubernetes_pod_uid
          - __meta_kubernetes_pod_container_name
        target_label: __path__
      - action: replace
        replacement: /var/log/pods/*\$1/*.log
        regex: true/(.*)
        separator: /
        source_labels:
          - __meta_kubernetes_pod_annotationpresent_kubernetes_io_config_hash
          - __meta_kubernetes_pod_annotation_kubernetes_io_config_hash
          - __meta_kubernetes_pod_container_name
        target_label: __path__
      - action: labelmap
        regex: __meta_kubernetes_pod_label_(.+)
EOF
$ helm upgrade -n monitoring --install promtail grafana/promtail -f promtail-config.yaml
This will install Promtail in the monitoring namespace.
Check that a Promtail pod is running.
We can access the Promtail UI at localhost:3101 to see all of the pods logs being tailed along with the labels assigned to them.
$ kubectl --namespace monitoring port-forward $(kubectl --namespace monitoring get daemonset -l app.kubernetes.io/instance=promtail -o name) 3101:3101
Install Grafana
Similarly, to install Grafana, run the following commands from a terminal.
helm repo add grafana https://grafana.github.io/helm-charts/
helm repo update
helm upgrade --install grafana grafana/grafana --create-namespace -n grafana
This will install Grafana in the grafana namespace
Accessing Grafana UI
The installation above creates a Service in grafana namespace. To access this, you can
- Create an Ingress for this service
- Use Kubernetes port forwarding
kubectl port-forward svc/grafana -n grafana 3000:80
Fetching Credentials of Grafana
Default user is “admin” For password, run the below command
kubectl get secret --namespace grafana grafana -o jsonpath="{.data.admin-password}" | base64 --decode
Adding Loki as a data source in Grafana
Clicking on the Settings icon in the left pane will bring up a menu, click on Data Sources.
Clicking on Add Data Source and select Loki.
Under HTTP, in the URL field put http://loki-gateway.monitoring.svc.cluster.local
Click on Save and Test and there should be a notification of the data source added successfully.
Running Log Queries
From the options in left pane, navigate to Explore.
Here you can run log queries using LogQL.
Since Loki auto scrapes labels, there will be example log queries presented.
There also will be list of log labels that you can select from.
You can run queries for Fission components such as:
- All logs from Fission Router
{svc="router"} - All logs from Fission Router that have “error” in the statement.
{svc="router"} |= "error"
Loki is great for performing metrics over the logs, for example:
- Count of all logs in Fission Router with “error” over span of 5 mins
count_over_time({svc="router"} |= "error" [5m]).
Querying logs from the Fission CLI
You do not have to open Grafana to read function logs.
With Loki configured, fission function logs --dbtype loki queries it directly, and a few filters make it easy to follow a single function or a single invocation:
# Stream a function's logs as they arrive
$ fission function logs --name hello --dbtype loki --follow

# Just the logs for one invocation, by its X-Fission-Request-ID
$ fission function logs --name hello --dbtype loki --request-id 6f1c2a9e-1c2b-4f0a-9d2e-7b3c2a1d4e5f

# Filter by trace id or level
$ fission function logs --name hello --dbtype loki --trace-id 4bf92f3577b34da6a3ce929d0e0e4736
$ fission function logs --name hello --dbtype loki --level error
--request-id, --trace-id, and --level are applied by the loki driver only; the default kubernetes driver ignores them.
The request id comes from the X-Fission-Request-ID response header or from fission function test — see Debugging and diagnosing functions for how to get it and attribute a failure to a component.
Fission Logs Dashboard
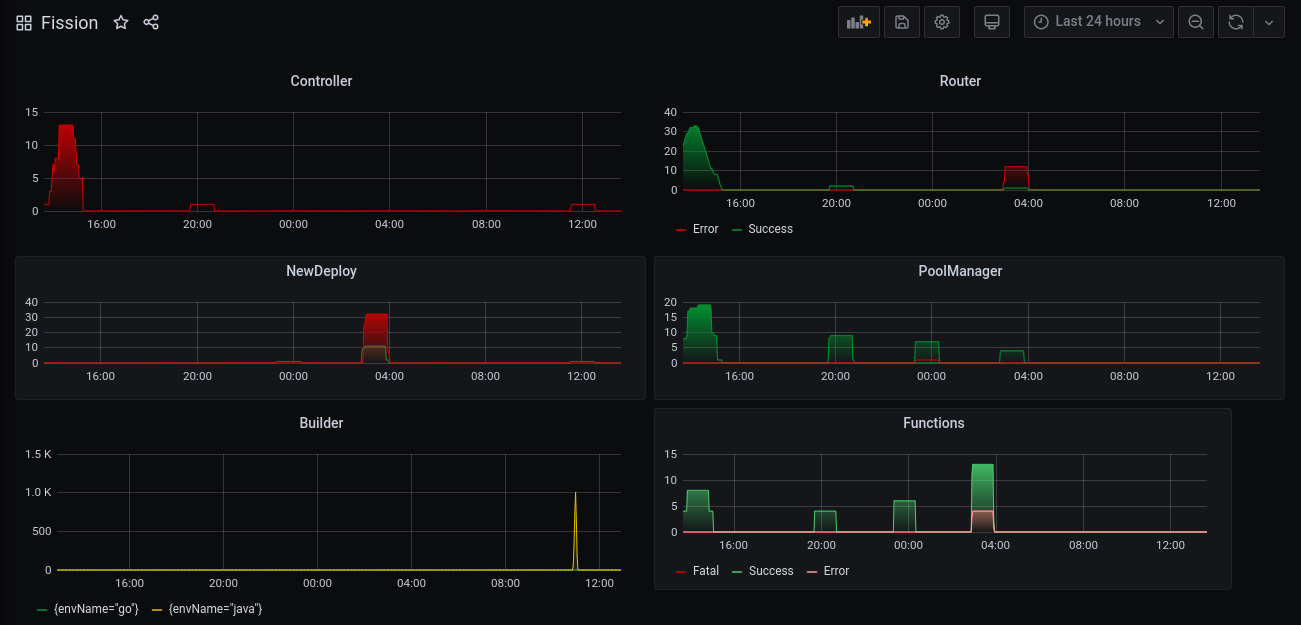
Grafana provides a great way to build visual dashboards by aggregating queries. These dashboards are a set of individual panels each showing visuals of some queries. Metrics over this logs can be seen in real time. The dashboards are also easily shareable.
Multiple panel with queries over Fission can be put together to get overall view of Fission components as well the Functions running within. An exported JSON of one such dashboard can be found here. This dashboard shows log metrics from all the major components of Fission.
Once imported, the dashboard will look similar to below image.
Watch the same location for more dashboards which will be added over time.