Observability with Linkerd
Observability with Linkerd
Linkerd is a lightweight service mesh that works out of the box with Fission and adds request-level metrics to your functions and to Fission itself. This guide walks you through meshing function and Fission pods so you can view success rate, request rate, and latency in Linkerd’s dashboard.
Prerequisites
You need to install Fission and Linkerd in the cluster.
Deploy a function in Fission
- Create a Fission environment:
fission env create --name node --image ghcr.io/fission/node-env
- Create a file with function code:
module.exports = async function(context) {
    return {
        status: 200,
        body: "Hello, world!\n"
    };
}
- Deploy the function:
fission fn create --name hello --code hello.js --env node
- Test the function:
fission fn test --name hello
Linkerd dashboard
Launch Linkerd’s dashboard to see the cluster’s meshed and unmeshed deployments:
linkerd dashboard &
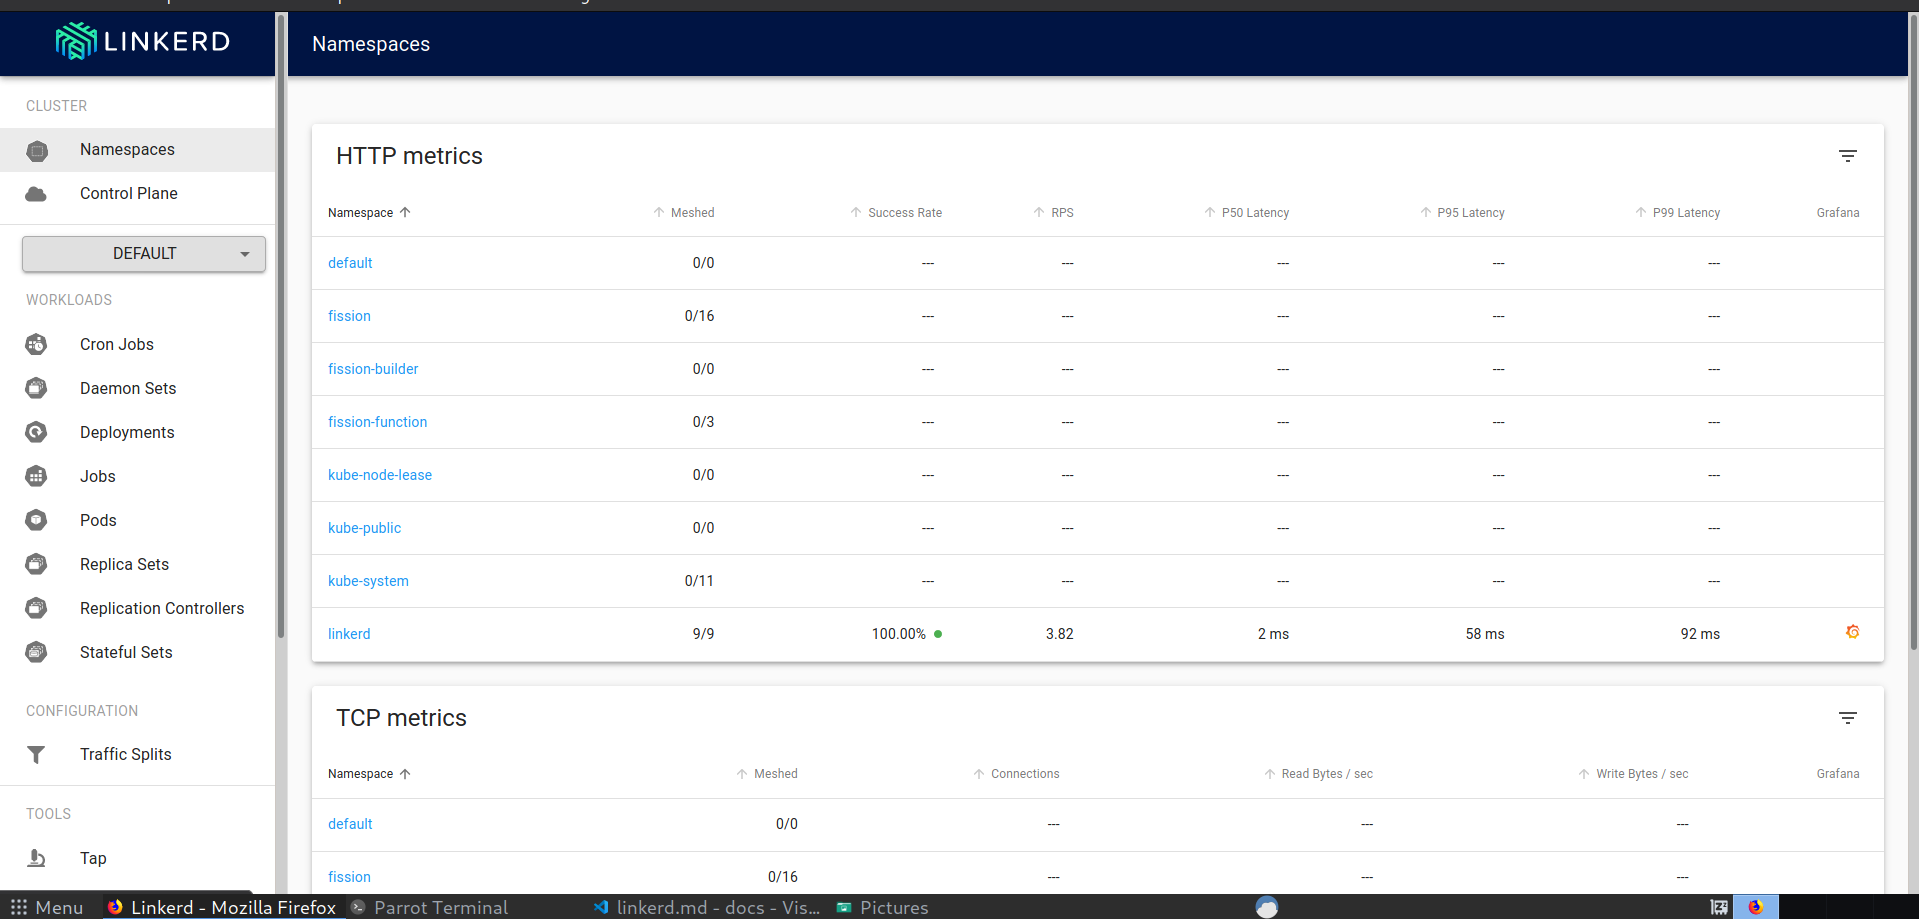
Under namespaces, select default and check the existing deployments — none are meshed yet:
Inject sidecar into deployments
Linkerd injects a sidecar proxy to add the deployment to its data plane. We can do this at namespace level so that all deployments in a namespace are meshed.
kubectl get deploy -o yaml \
| linkerd inject - \
| kubectl apply -f -
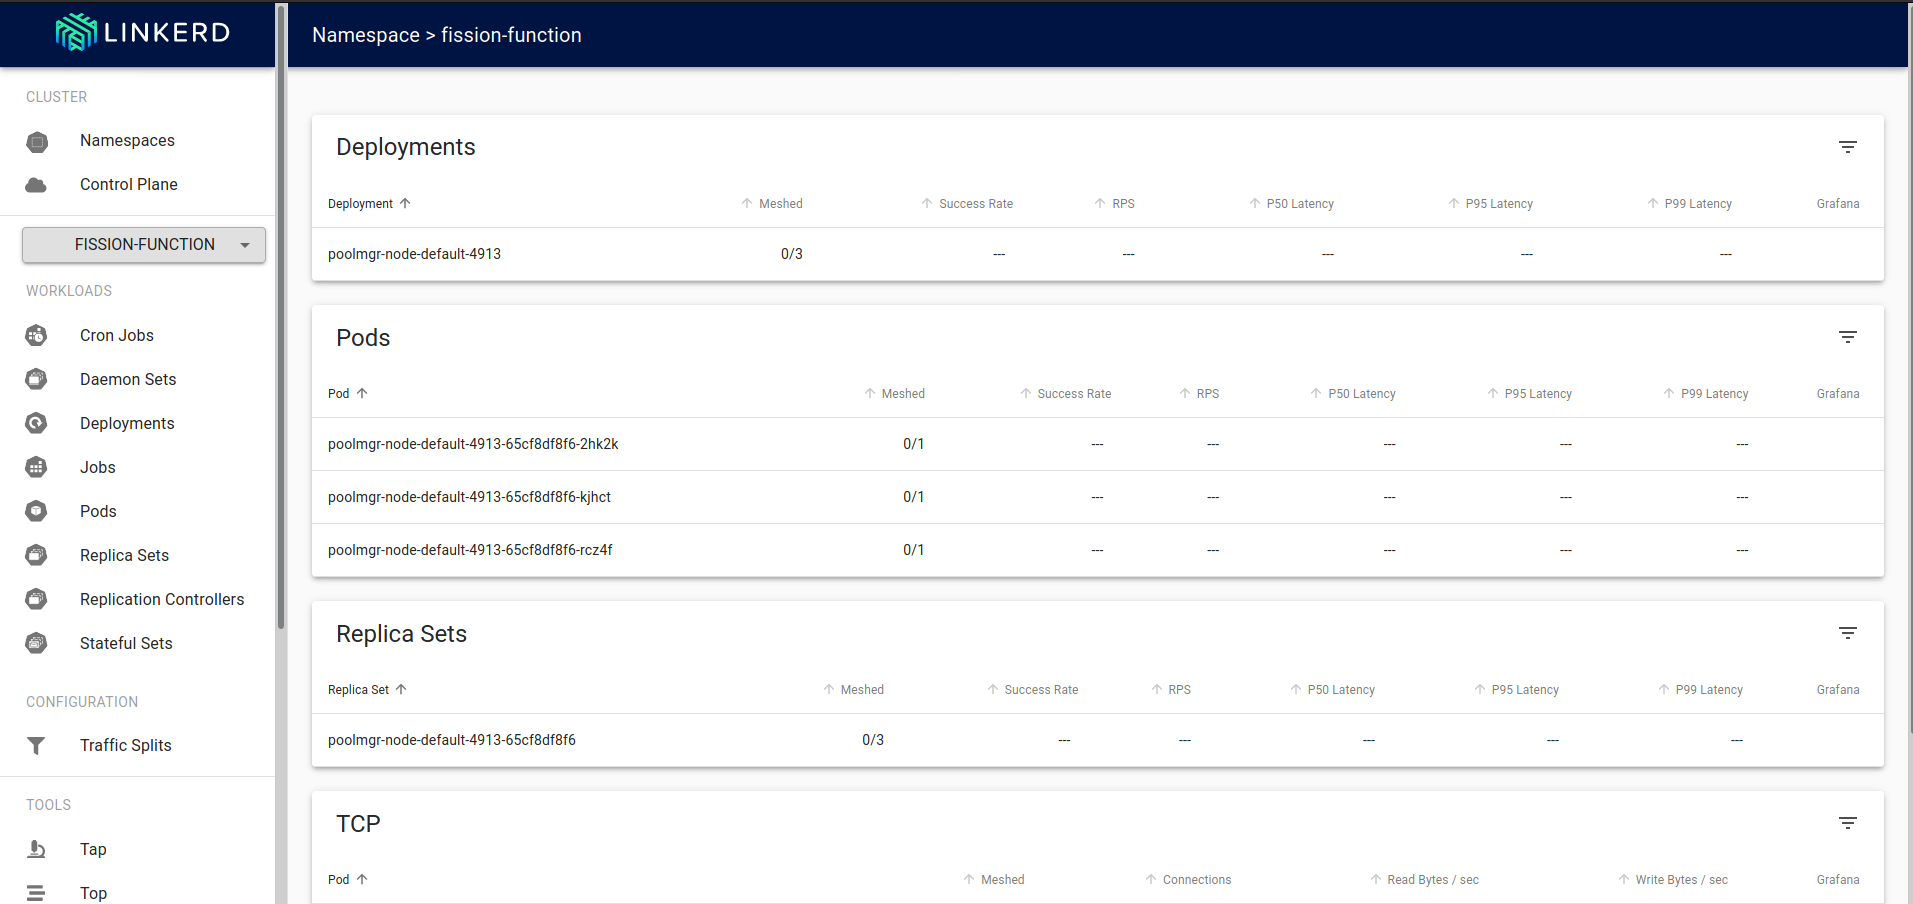
The dashboard shows whether the deployment is “meshed”, i.e. whether the sidecar proxy was injected:
Notice the metrics like Request Per Second (RPS) and PX Latency.
Generate traffic and view metrics
Generate some traffic to the function:
while true; do sleep 1; curl http://${FISSION_ROUTER}/hello; echo -e '\n\n\n\n'$(date);done
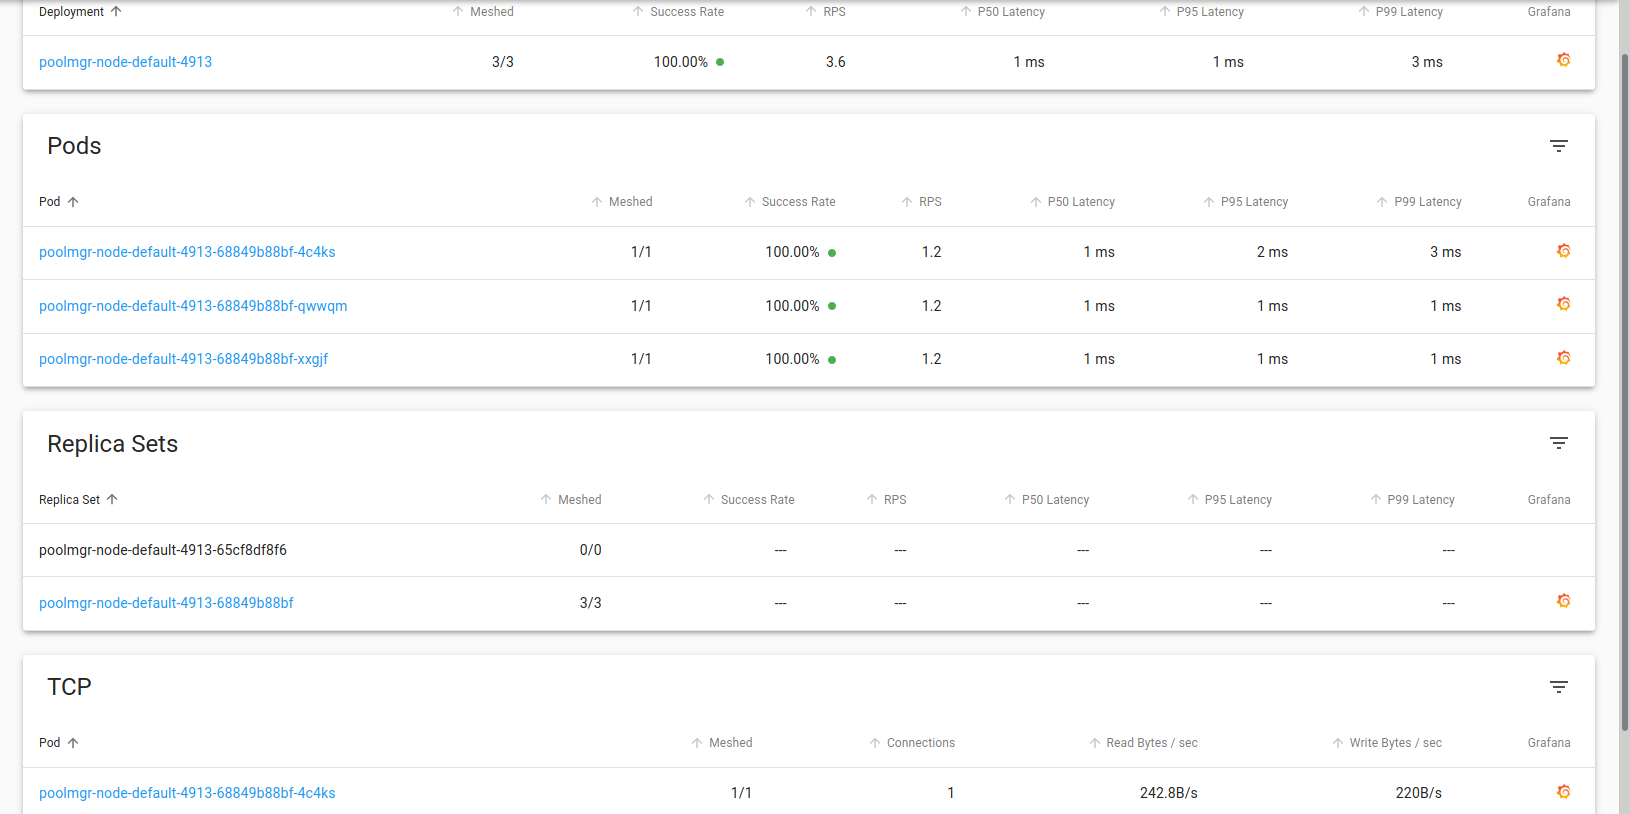
With traffic flowing, the Grafana dashboard next to the deployment shows live metrics:
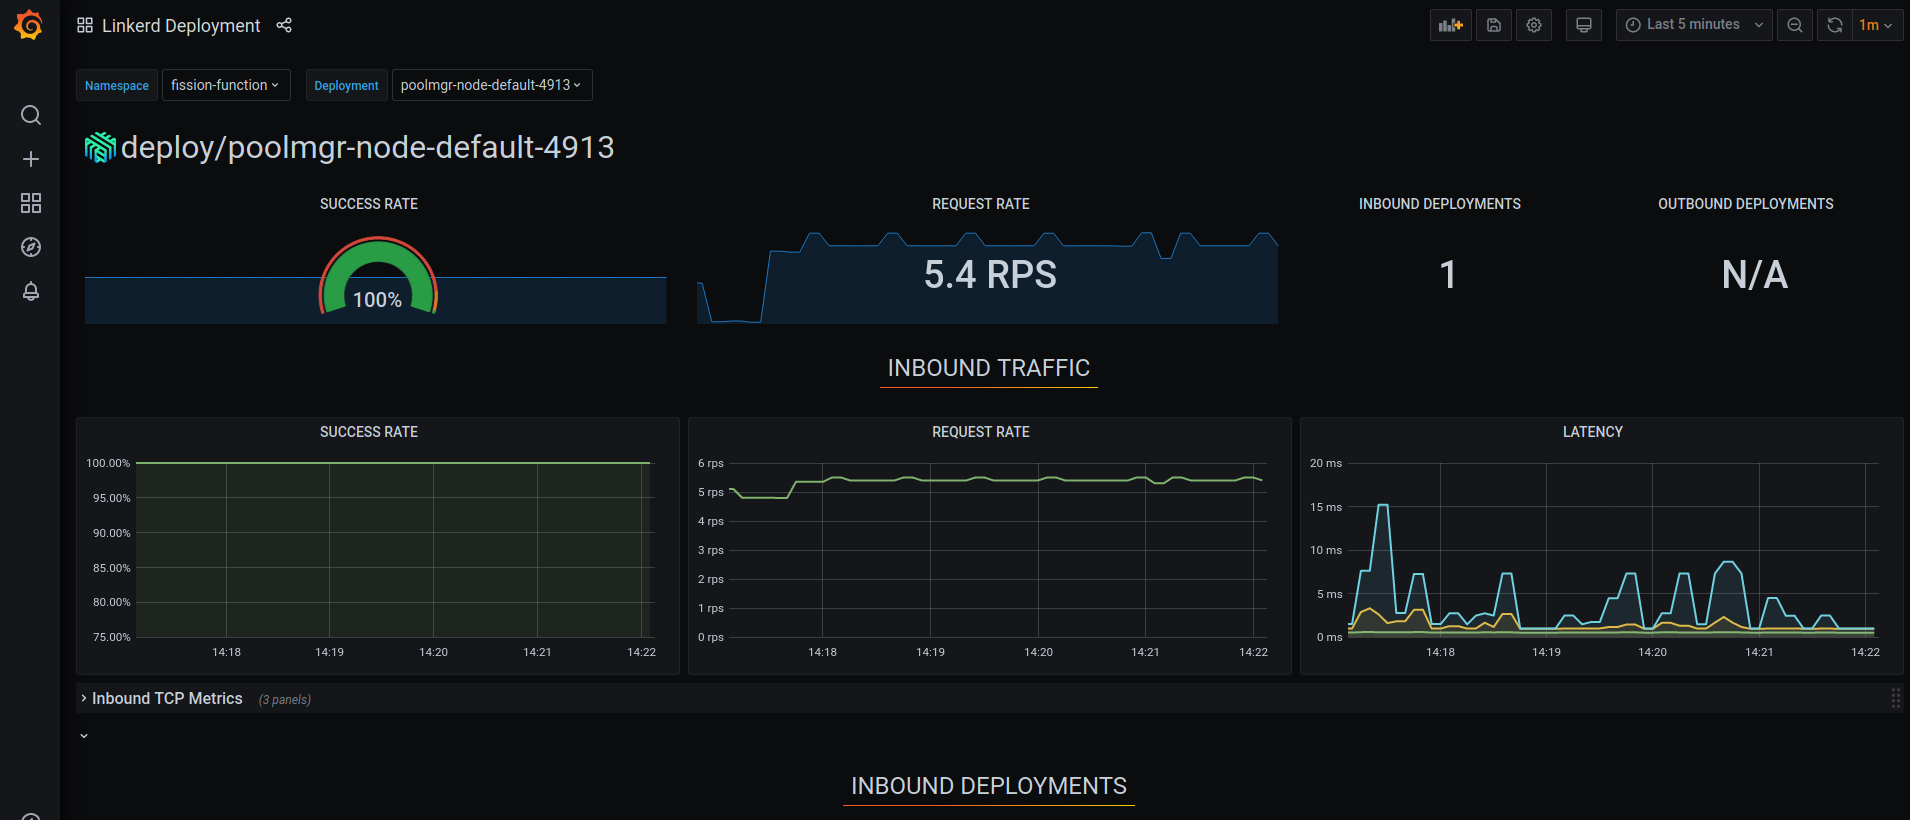
Success rate, request rate, and latency of the function are now all visible in one place.
Observing Fission components
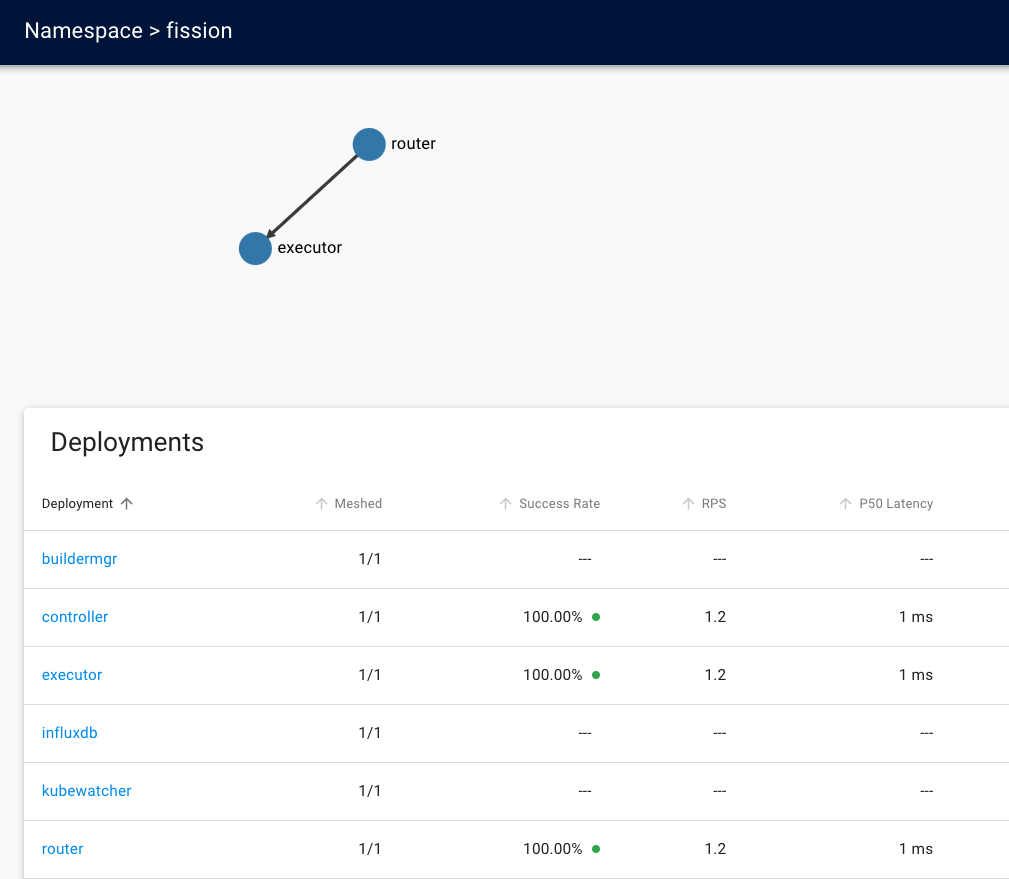
Mesh the fission namespace the same way to observe Fission’s own components, not just your functions:
kubectl get -n  fission deploy -o yaml \
| linkerd inject - \
| kubectl apply -f -
The same Grafana dashboard now reports success rate, request rate, and latency for Fission’s control-plane deployments: