Observability with OpenTelemetry & Datadog in Fission
Categories:
Software development isn’t just about writing a piece of code and running it. There are a lot of other processes around it that ensure that your code is going to work as expected in the real world. Amongst all such practices, Observability is going to be our point of discussion today.
Observability is all about gaining greater control and visibility over your application. It actually tells you what is really happening in your application. With most of the applications today adopting a microservices-oriented architecture, the applications have become complex with a lot of moving parts. And hence observability is a key to build a robust and reliable system. Logs, Metrics and Trace are the 3 pillars of observability. While logs and metrics are very helpful, trace allows you to traverse the entire journey of a request.
There are a handful of applications out there that help you with observability. However, one of the major problems with them is that they aren’t vendor agnostic. It means that if you want to change your observability tool, you will have to rewrite the code as well. That’s where OpenTelemetry comes into the picture.
OpenTelemetry & Datadog
OpenTelemetry gives us vendor-neutral APIs that helps us collect and export our traces to any 3rd party application. That means that OpenTelemetry will help you collect the traces and send it to any application that you want to by just changing the configuration. You can export your traces to applications like Jaeger, Datadog, Signoz or anything else that you use.
Datadog on the other hand is an observability service for cloud applications. It allows you to monitor databases, servers, applications, tools & services. It provides you with multiple integration options from where we could send metrics, logs and trace data to Datadog. OpenTelemetry has Datadog integration which can be used to share traces from our application.
Integrating OpenTelemetry & Datadog with Fission for enhanced Tracing
Now that we have a basic understanding of observability, OpenTelemetry and Datadog, let’s try to integrate all of them! In today’s blog post, I’ll show you how we can integrate OpenTelemetry and Datadog with Fission functions for enhanced tracing. This example will show you how you can create custom traces in your Fission functions, and then using OpenTelemetry send them to Datadog. The sample code is written in Python and uses OpenTelemetry SDK along with Datadog and Fission
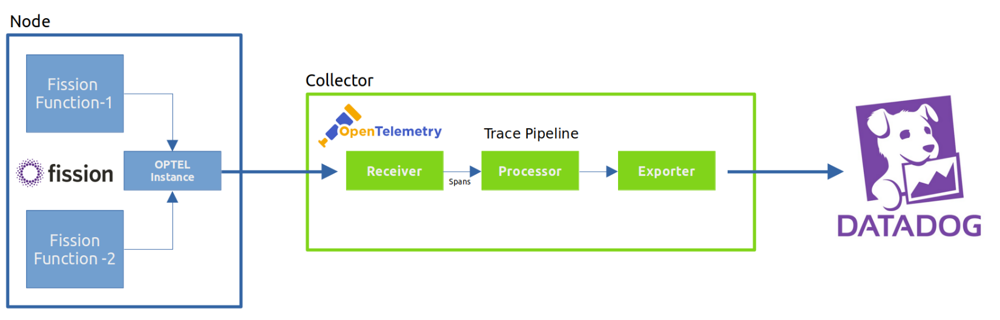
Architecture diagram of our app using Fission function, OpenTelemetry & Datadog
Pre Requisites
As a developer, you already know that you simply cannot start coding without setting up the environment. So, let’s look into the pre requisites that are required to send traces to Datadog using OpenTelemetry and Fission. The entire source code for this application can be found in our OpenTelemetry Datadog Sample Repo.
So let’s get started!
Fission
You can refer to our Fission Installation guide for installing Fission on Kubernetes cluster.
You also need to configure Fission with OpenTelemetry to enable OpenTelemetry Collector that is reuqired to collect the trace.
You can cuse the following yaml code to get the configuration done.
export FISSION_NAMESPACE=fission
helm install --namespace $FISSION_NAMESPACE \
fission fission-charts/fission-all \
--set openTelemetry.otlpCollectorEndpoint="otel-collector.opentelemetry-operator-system.svc:4317" \
--set openTelemetry.otlpInsecure=true \
--set openTelemetry.tracesSampler="parentbased_traceidratio" \
--set openTelemetry.tracesSamplingRate="1"
OpenTelemetry Configuration
To send our traces to Datadog from OpenTelemetry, we first need to make use of OpenTelemetry Collector that will help collect the traces.
It will internally share the traces with an OpenTelemetry Processor that will eventually share it with an OpenTelemetry Exporter that will finally send the traces to Datadog.
To manage all of this, OpenTelemetry provides us with an OpenTelemetry Operator.
The operator can be used to provision and maintain OpenTelemetry Collector instance along with handling its configuration changes.
However, to use the operator in an existing cluster, we need to add a cert-manager.
You can use the following commands to add cert-manager to your existing cluster and install the OpenTelemetry Operator:
# cert-manager
kubectl apply -f https://github.com/jetstack/cert-manager/releases/latest/download/cert-manager.yaml

# open telemetry operator
kubectl apply -f https://github.com/open-telemetry/opentelemetry-operator/releases/latest/download/opentelemetry-operator.yaml
The OpenTelemetry Collector is a vendor agnostic agent that can send and receive metrics, traces to different tools in different formats.
In order to use it with Fission functions, we need to modify the OpenTelemetry Collector configuration as follows.
Under exporters add Datadog and make sure to update your API KEY in the following yaml configuration.
...
...
apiVersion: v1
kind: ConfigMap
metadata:
  name: otel-collector-conf
  labels:
    app: opentelemetry
    component: otel-collector-conf
data:
  otel-collector-config: |
    receivers:
      otlp:
        protocols:
          grpc:
          http:
    processors:
      batch:
        timeout: 10s
      k8sattributes:
    extensions:
      health_check: {}
      zpages: {}
    exporters:
      datadog:
        api:
          key: <YOUR_API_KEY>
    service:
      telemetry:
        logs:
          level: "DEBUG"
      extensions: [health_check, zpages]
      pipelines:
        metrics/2:
          receivers: [otlp]
          processors: [batch, k8sattributes]
          exporters: [datadog]
        traces/2:
          receivers: [otlp]
          processors: [batch, k8sattributes]
          exporters: [datadog]```
...
...
Note: The complete yaml configuration that you need to apply for
OpenTelemetryto work correctly can be found in the optel-config.yaml file. Use the commandkubectl apply -f optel-config.yamlto apply the configuration.
Datadog
Since we are going to use Datadog for this example, we need to have a Datadog account. They offer multiple pricing plans, however the free tier is good enough for this example. You can register for a trial account by visiting DatadogHQ.
Once you have the account, you need to generate an API KEY to autheticate our app to share trace data with Datadog.
To get this, navigate to Personal Settings -> Security -> Application Keys.
Click on New Key and generate a Key.
Note down the API KEY that will be used later.
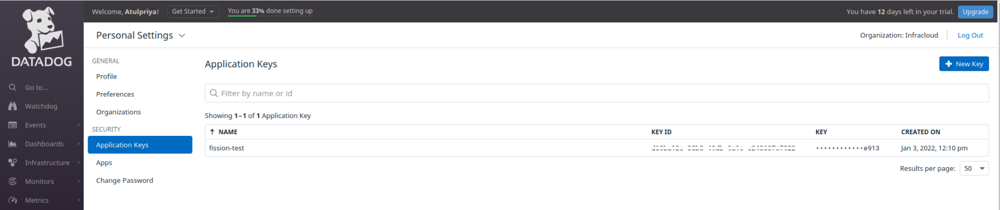
Generating API key from Datadog
Environment Setup
Now that we have all the prerequisites in place to send trace to Datadog using OpenTelemetry & Fission, let us set up the envinronment needed to run our Fission function.
Building Custom Python Environment
The OpenTelemetry SDK for Python requires certain C libraries and external linux kernel headers to be present in the Python environment for the OpenTelemetry to work correctly.
Please refer to Fisson Python Environment and follow the steps to create a custom image.
In this case we need linux-headers.
For this you need to update the Dockerfile and append the required libraries in the RUN command.
It should look like this: RUN apk add --update --no-cache gcc python3-dev build-base libev-dev libffi-dev bash linux-headers.
Building the docker image for our custom Python environment. (Replace the username with your actual username on Docker Hub.)
docker build -t username/python-opentelemetry --build-arg PY_BASE_IMG=3.7-alpine -f Dockerfile .
Pushing the docker image to Docker Hub registry:
docker push username/python-opentelemetry
Steps
Create Fission environment:
fission env create --name pythonoptel --image username/python-opentelemetry --builder ghcr.io/fission/python-builder
Create source package. To create a source package you need to zip the source folder. Execute the below command to generate the zip archive:
./package.sh
Make sure that build.sh file is executable before you create the zip. Update the permissions using
chmod +x build.sh
Once the zip archive is ready, execute the following command to create the package.
fission package create --name fissionoptel-pkg --sourcearchive sample.zip --env pythonoptel --buildcmd "./build.sh"
Note: The package creation process can take a long time especially while building
grpcio, so plesae be patient. You can check the progress of this usingstern. In a new terminal window, executestern '.*'to see the status of package creation.
Create Fission function using the package created above:
fission fn create --name optel --pkg fissionoptel-pkg --entrypoint "sample.main"
With this our custom Python environment is ready along with our Fission function.
Tip: You can also create a Fission Spec of all the commands.
Spec Generation Commands
fission spec init
fission env create --name pythonoptel --image atulinfracloud/python-opentelemetry  --builder ghcr.io/fission/python-builder --spec
fission package create --name fissionoptel-pkg --sourcearchive sample.zip --env pythonoptel --buildcmd "./build.sh" --spec
fission fn create --name optel --pkg fissionoptel-pkg --entrypoint "sample.main" --spec
Applying Specs
fission spec apply # Ensure you run package.sh first
Once the specs are applied, all the resources for this app will be created.
Viewing The Traces on Datadog
To view the traces on Datadog, login to your Datadog dashboard and navigate to APM -> Services page.
Execute the function using fission fn test --name optel command and wait for the traces to be captured.
Once captured, you will see fission-router, fission-executor, fission-fetcher and our fission-sample-service service under the services list.
Click on Traces option on the top of the page to view the traces.
Here, you will see the traces fission-router, fission-executor, fission-sample-service, fission-fetcher in the list.
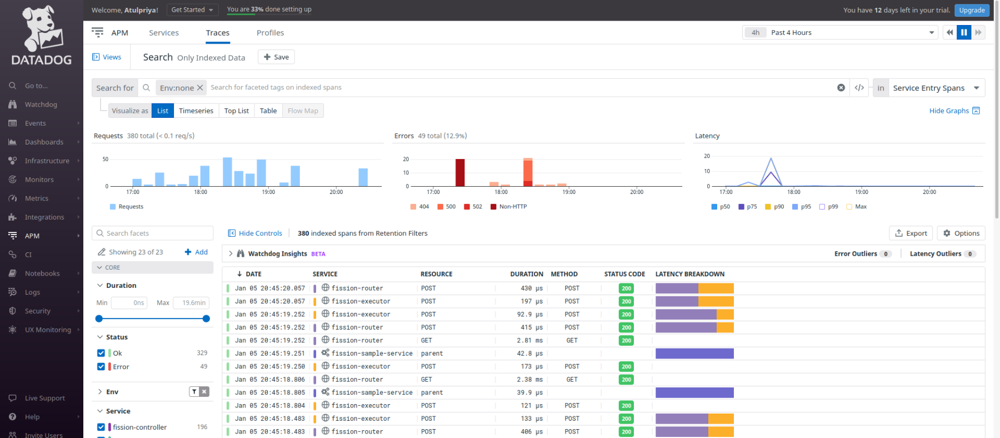
Traces from Fission function on Datadog dashboard sent using OpenTelemetry
Clicking on a trace will further expand and show the details of the trace along with the spans. At the bottom of the pane, you can get more details about the span, the type of request, time taken to execute etc.
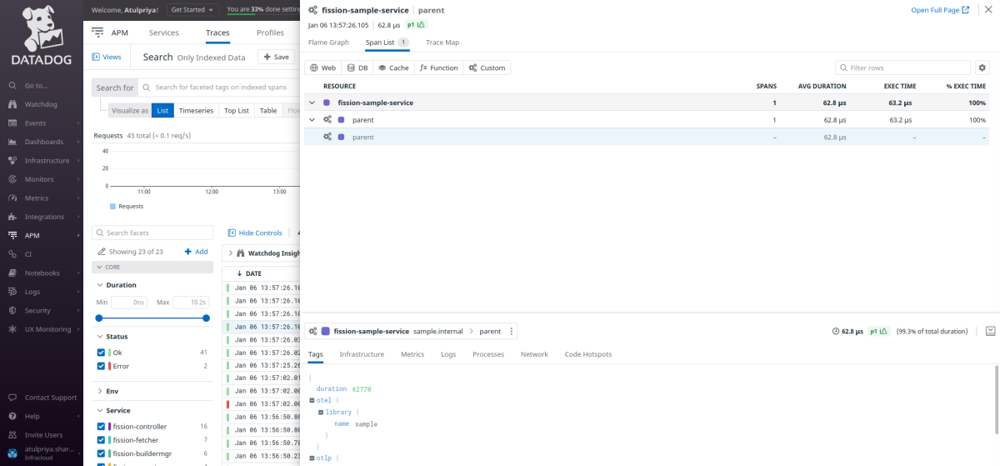
Spans exported from our Fission function to Datadog using OpenTelemetry
Conclusion
By now, you would have understood how Fission integrates with OpenTelemetry and how you can send custom traces to Datadog. You will now be able to build similar real life applications where you can deploy Fission along with OpenTelemetry and a tracing backend of your choice. Developing and Testing is fine, but is your application observable? Your answer should be a Yes after completing this turorial! Feel free to reach out to the author in case you have any issues or need clarifications for this.
Want more?
More examples can be found in our examples directory on GitHub. Follow Fission on Twitter for more updates!
Author:
Atulpriya Sharma | Developer Advocate - InfraCloud Technologies