Monitoring Fission logs with Grafana Loki
Categories:
Importance of Logs
Proper logging in a software is a quick and systematic way to inform the state of the software. Although the definition of ’logs’ remains the same along years in software engineering, the scope of what logs are used is has always been increasing. Apart from helping developers and operators, logs can be used by complimenting software for security, metrics, triggers, cost estimation and other different operations.
Logs in Fission
Fission works in a systematic way where there are different services (containers) providing functionalities for running applications (Functions) in a serverless way. Logs in Fission thus comprise of log statements from these services as well as from the applications.
A good log monitoring solution can be useful to make full use of these logs.
Grafana Loki
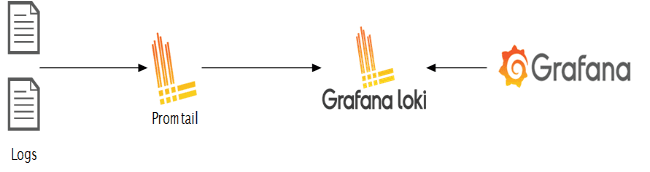
Grafana Loki is a set of components which provides fully featured logging stack. This comprises of a client to fetch the logs, an aggregator and a visualizing tool.
The stack supports multiple clients, for the case here we will use Promtail which is the recommended client when using the stack in Kubernetes. The components are briefed below.
- Loki - Loki is a horizontally scalable, highly available, multi-tenant log aggregation system inspired by Prometheus.
- Promtail - Promtail is the client which fetches and forwards the logs to Loki. It is a good fit for Kubernetes as it automatically fetches metadata such as pod labels.
- Grafana - A visualizing tool which supports Loki as a data source.
The stack is depicted briefly in the below image
Setting up
There are different ways and configurations to install the complete stack. For this case, we’ll use Helm.
Prerequisite
- Kubernetes cluster
- Fission installed in the cluster
- Helm (This post assumes helm 3 in use)
- kubectl and kubeconfig configured
Install Loki and Promtail
From a terminal, run the following commands to add the Loki repo and then install Loki
helm repo add grafana https://grafana.github.io/helm-charts/
helm repo update
helm upgrade --install loki grafana/loki-stack
This will install Loki in the default namespace. Check if there’re pods running for Loki and Promtail. This also creates a Service. Note the ClusterIP of this service which will be needed further.
Install Grafana
Similarly, to install Grafana, run the following commands from a terminal.
helm repo add grafana https://grafana.github.io/helm-charts/
helm repo update
helm upgrade --install grafana grafana/grafana --create-namespace -n grafana
This will install Grafana in the grafana namespace
Accessing Grafana UI
The installation above creates a Service in grafana namespace. To access this, you can
- Create an Ingress for this service
- Use Kubernetes port forwarding
kubectl port-forward svc/grafana -n grafana 3000:80
Fetching Credentials of Grafana
Default user is “admin” For password, run the below command
kubectl get secret --namespace grafana grafana -o jsonpath="{.data.admin-password}" | base64 --decode
Adding Loki as a data source in Grafana
Clicking on the Settings icon in the left pane will bring up a menu, click on Data Sources. Clicking on Add Data Source and select Loki.
Under HTTP, in the URL field, put the service URL followed by 3100 which is the default port of Loki. For example, If the Loki is installed in default namespace , we can enter ‘http://loki.default:3100’. Click on Save and Test and there should be a notification of the data source added successfully.
Running Log Queries
From the options in left pane, navigate to Explore. Here you can run log queries using LogQL. Since Loki auto scrapes labels, there will be example log queries presented. There also will be list of log labels that you can select from.
You can run queries for Fission components such as:
- All logs from Fission Router
{app="router"} - All logs from Fission Router that have “error” in the statement.
{app="router"} |= "error"
Loki is great for performing metrics over the logs, for example:
- Count of all logs in Fission Router with “error” over span of 5 mins
count_over_time({app="router"} |= "error" [5m])
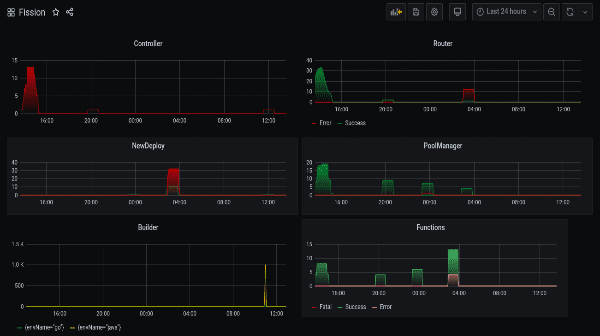
Fission Logs Dashboard
Grafana provides a great way to build visual dashboards by aggregating queries. These dashboards are a set of individual panels each showing visuals of some queries. Metrics over this logs can be seen in real time. The dashboards are also easily shareable.
Multiple panel with queries over Fission can be put together to get overall view of Fission components as well the Functions running within. An exported JSON of one such dashboard can be found here. This dashboard shows log metrics from all the major components of Fission.
Once imported, the dashboard will look similar to below image.
Authors:
- Sahil Lakhwani Software Engineer - InfraCloud Technologies