Monitor Fission serverless functions with OpenTracing
Categories:
Introduction
As the number of functions and their usage grows, it is crucial to monitor and manage them effectively. Fission already supports logs on CLI as well integration with external systems using Fluentd. Fission also has monitoring enabled using Prometheus and provides a great way to measure and track your functions automatically.
Serverless functions can be part of a larger distributed system. For example, in the case of serverless applications that become more complex - spanning multiple functions, or in Microservices where functions are triggered between different services that talk to each other to process a single request or perform a business function.
To ensure smooth operations of distributed systems you need to trace each request across multiple functions and invocations. This is critical so that you have a thorough understanding of the system’s behavior and can track performance across all its components.
Recently, Fission added support for OpenTracing with release 1.0.0 and this makes monitoring and tracing functions at scale easy. In this post, we will set up OpenTracing along with Fission and then test out a few simple functions to validate.
SHOUTOUT: Thanks to one of our awesome contributors Adam Bouhenguel for incorporating the OpenTracing change in Fission!
OpenTracing in Fission
Fission uses the OpenCensus project for enabling tracing. This enables a user to use any of the backends supported by OpenCensus. Currently, the following backends are supported by OpenCensus and can be used as backends for Fission tracing
- AWS X-Ray
- Azure Monitor
- Datadog
- Honeycomb
- Jaeger
- Stackdriver
- Zipkin
Tutorial
The rest of this post will walk through a step by step guide for setting up Jaeger as opentracing backend and Fission together.
Setup OpenTracing
For the purpose of this tutorial, we will set up OpenTracing with the Jaeger backend - with a simple all in one topology.
For your own production environments, you can either set up Jaeger with different configuration outlined in their setup guide or use a different backend supported by OpenCensus.
After setting up an all in one Jaeger you will see one deployment and four services including one for Jaeger UI which has a LoadBalancer for accessing it outside of the cluster.
NAME                                     READY     STATUS    RESTARTS   AGE
pod/jaeger-deployment-5bd9f6d7ff-m44tt   1/1       Running   0          7d

NAME                       TYPE           CLUSTER-IP      EXTERNAL-IP     PORT(S)                               AGE
service/jaeger-agent       ClusterIP      None            <none>          5775/UDP,6831/UDP,6832/UDP,5778/TCP   29d
service/jaeger-collector   ClusterIP      10.19.248.205   <none>          14267/TCP,14268/TCP,9411/TCP          29d
service/jaeger-query       LoadBalancer   10.19.251.176   35.200.179.88   80:32599/TCP                          29d
service/zipkin             ClusterIP      None            <none>          9411/TCP                              29d

NAME                                DESIRED   CURRENT   UP-TO-DATE   AVAILABLE   AGE
deployment.apps/jaeger-deployment   1         1         1            1           29d

NAME                                           DESIRED   CURRENT   READY     AGE
replicaset.apps/jaeger-deployment-5bd9f6d7ff   1         1         1         29d
You can also verify your set up by visiting the Jaeger UI at the public IP of the load balancer.
One of the things we will need to configure in Fission is the collector endpoint, so you’d need the DNS name of the collector service. Assuming that Jaeger is deployed in jaeger namespace the address of the collector service above will be “jaeger-collector.jaeger.svc”
Setup Fission
Configure the Jaeger Collector endpoint
Before you install Fission, first we need to configure the the jaeger collector endpoint in the Fission configuration. If you are using Helm then the following entry will need to be added in values.yaml:
traceCollectorEndpoint: "http://jaeger-collector.jaeger.svc:14268/api/traces?format=jaeger.thrift"
If you are using plain YAMLs instead, then you will need to populate the value of argument –collectorEndpoint to all deployments and also populate the value of environment variable “TRACE_JAEGER_COLLECTOR_ENDPOINT” in all places it is used.
If there are connection errors reaching the Jaeger collector endpoint then you will see warnings in the pods of the executor/router etc. If you don’t see any warnings then everything is working and we can continue.
Create a Fission function to test your tracing
Now that we are set up, let’s create a simple function and test the tracing! Follow the commands below to create a simple hello world function:
$ fission env create --name nodejs --image ghcr.io/fission/node-env
environment 'nodejs' created

$ fission fn create --name hellojs -env nodejs --code hello.js
Package 'hello-js-u04d' created
function 'hellojs' created

$ fission fn test --name hellojs
hello, world!
You will notice that the Fission services are now visible in Jaeger UI.
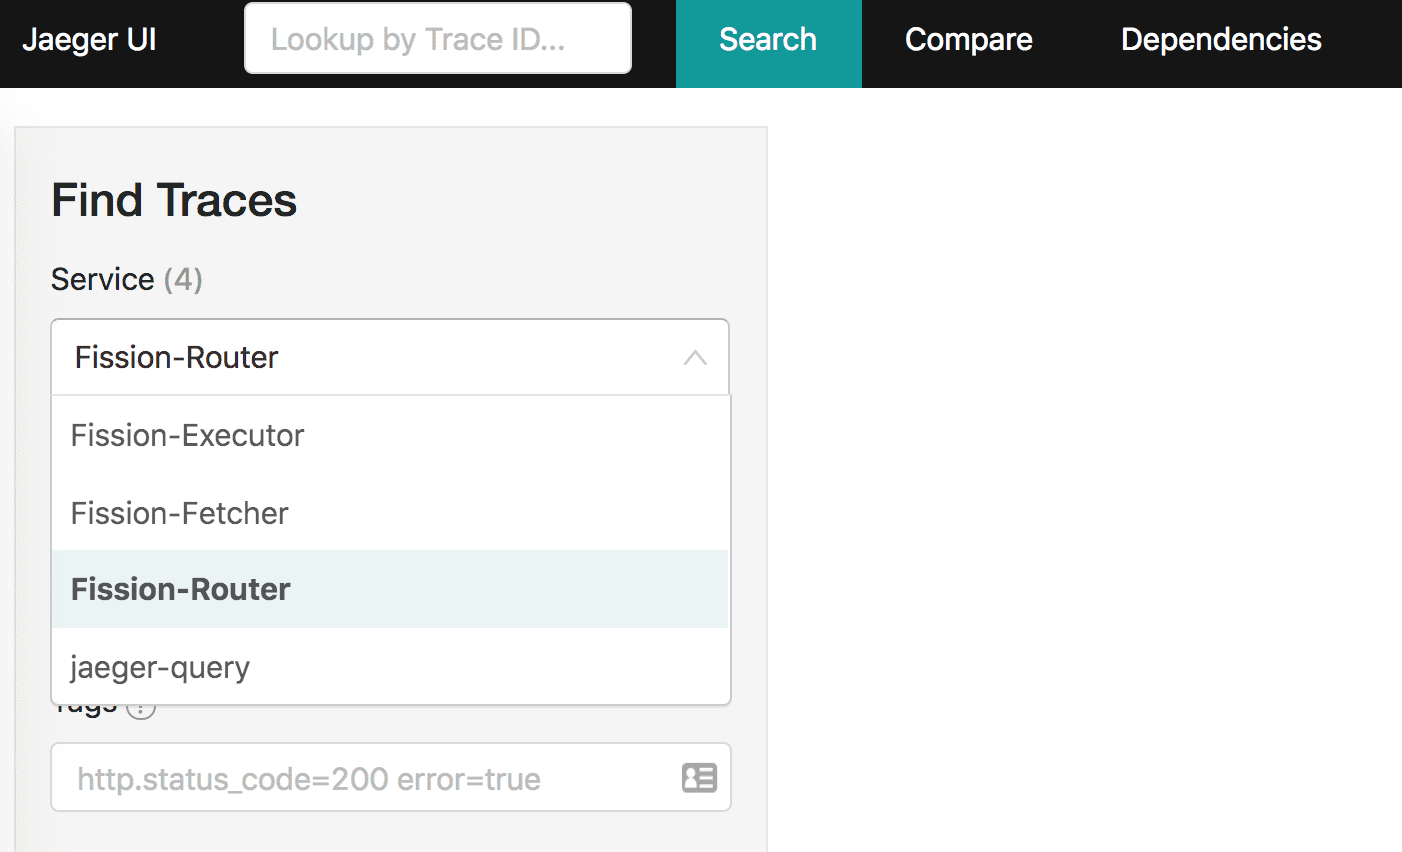
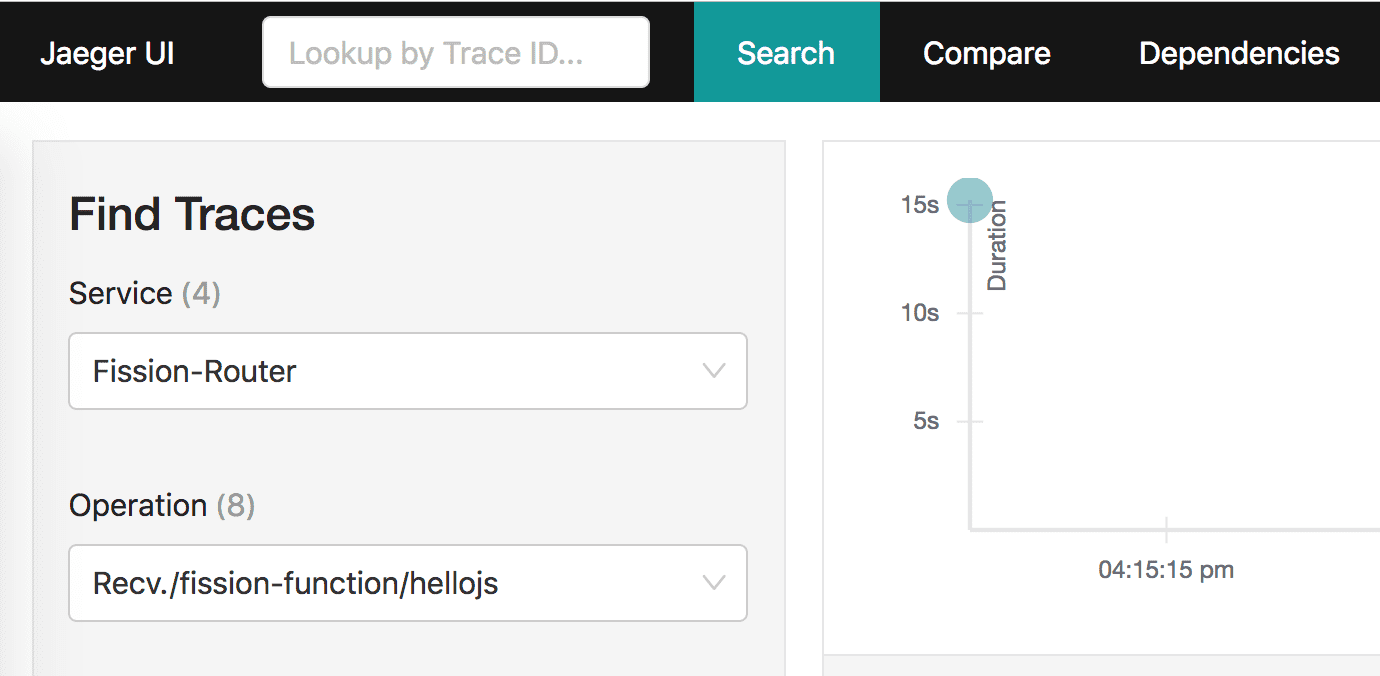
Let’s choose the Fission router service and hellojs operation which corresponds to our recent invocation and search for traces.
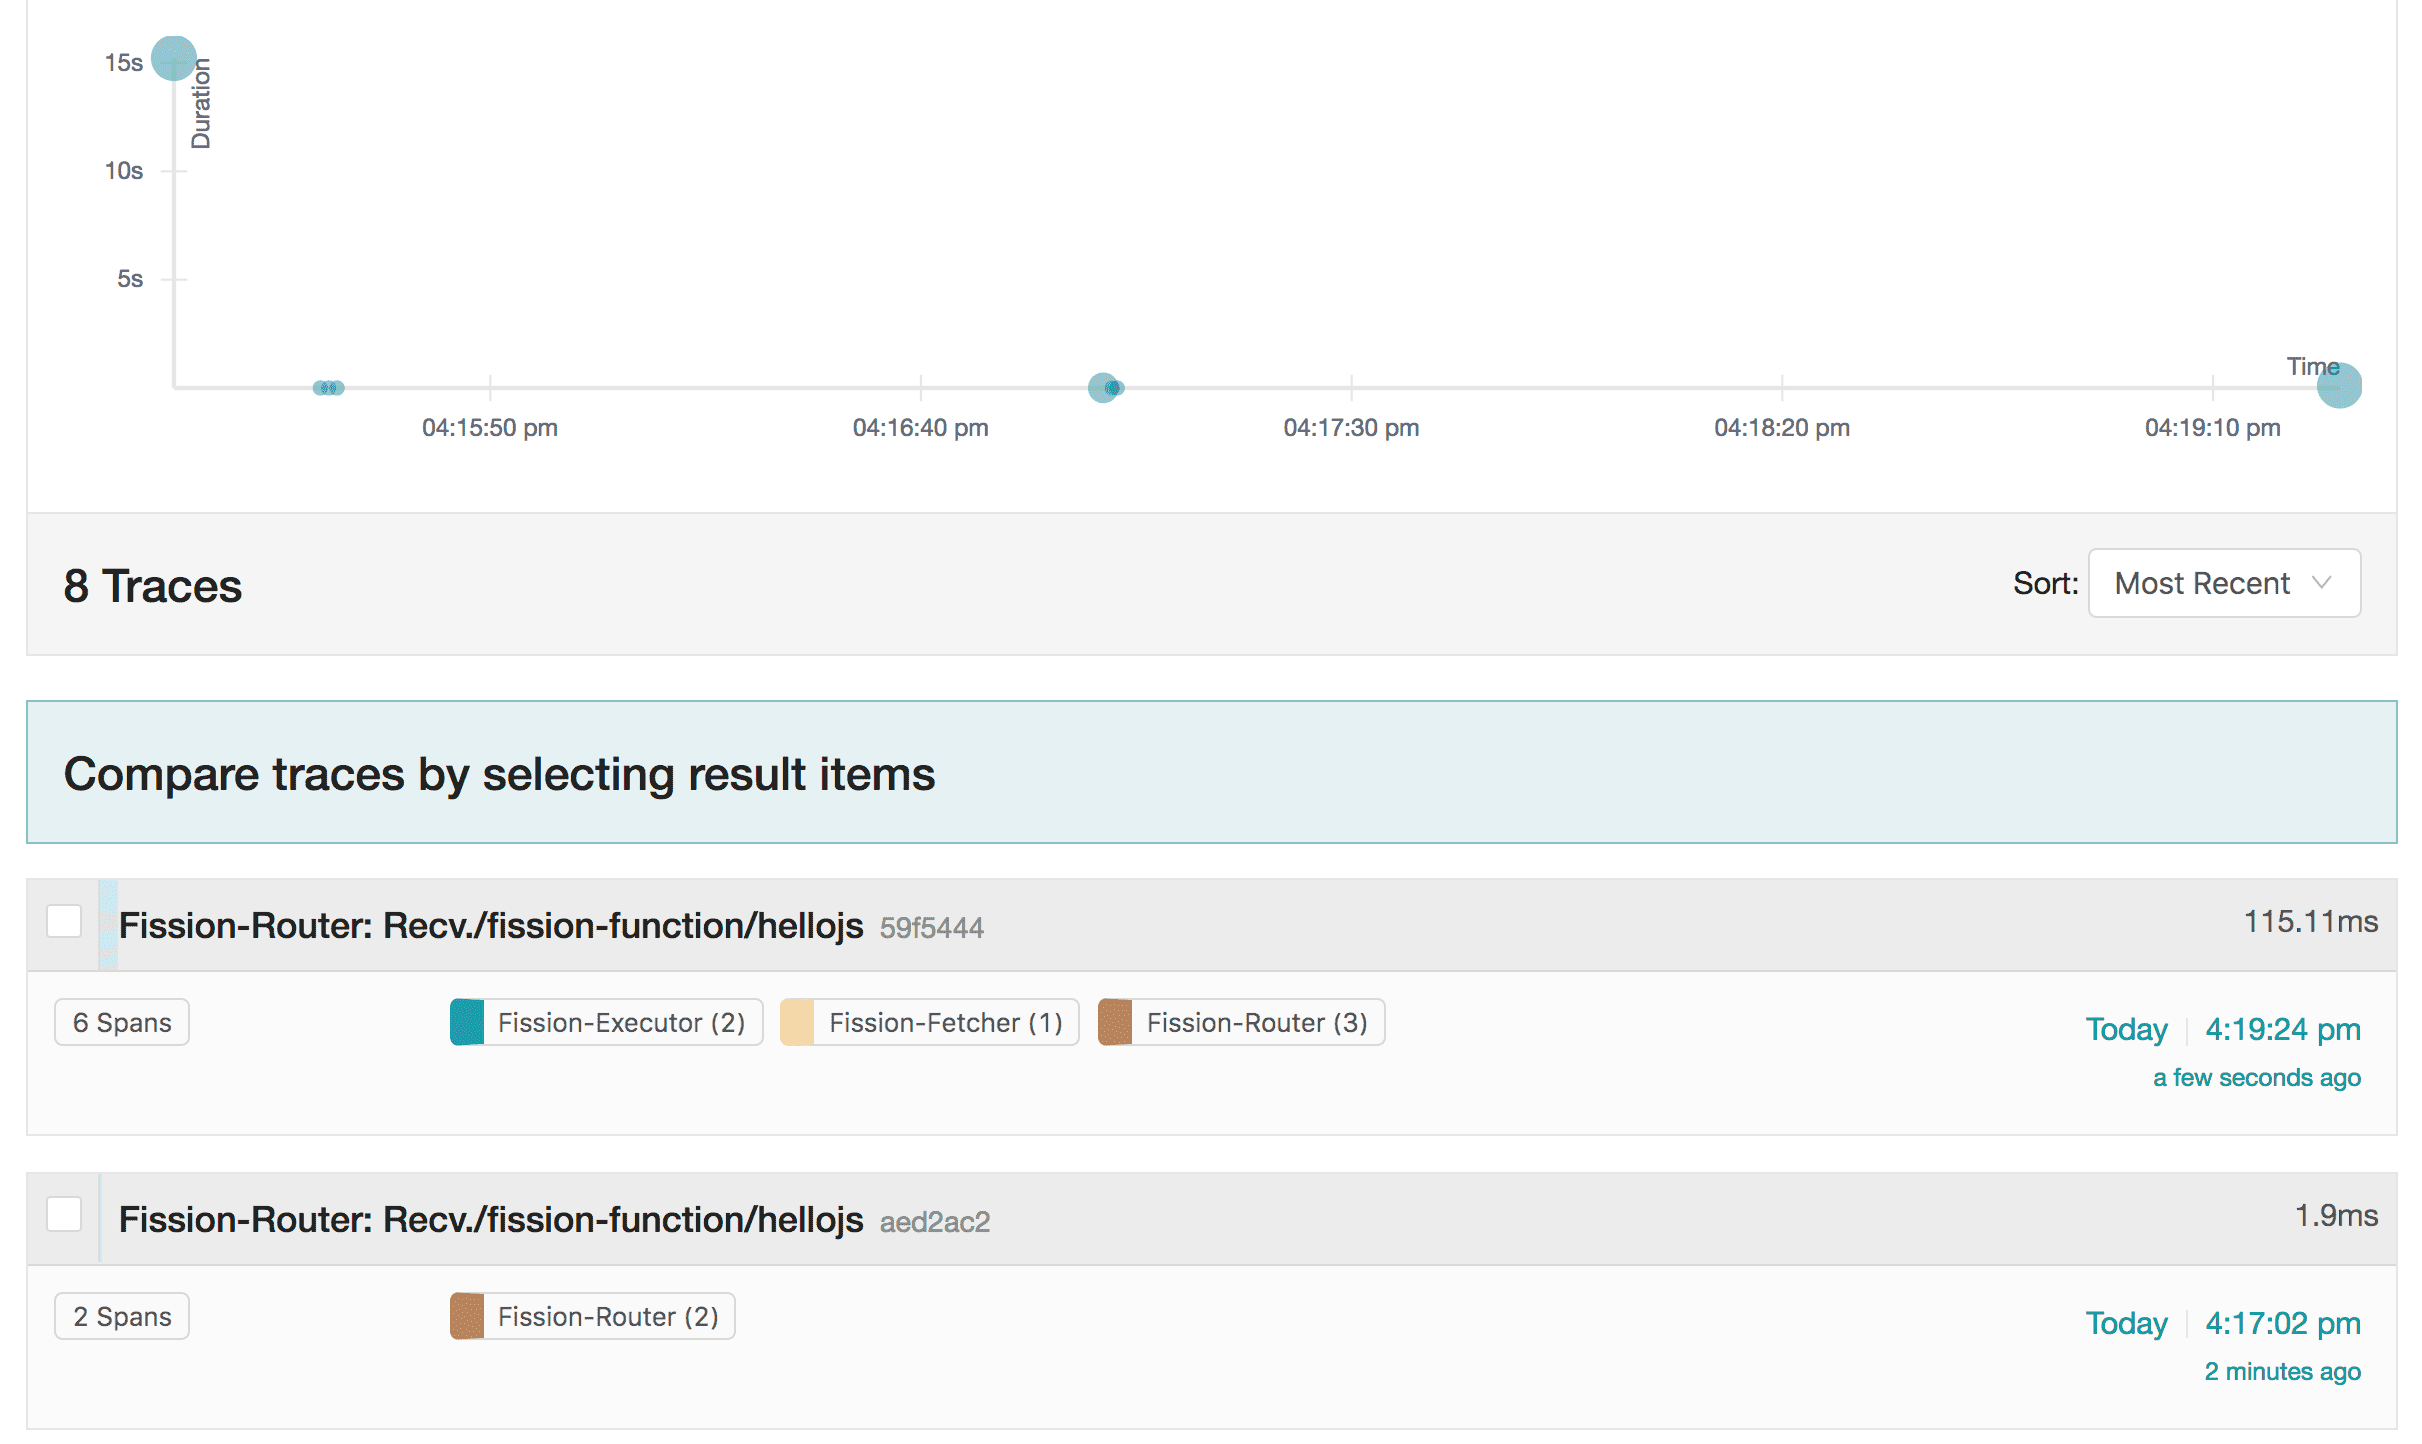
We can see the function’s recent invocations and the traces.
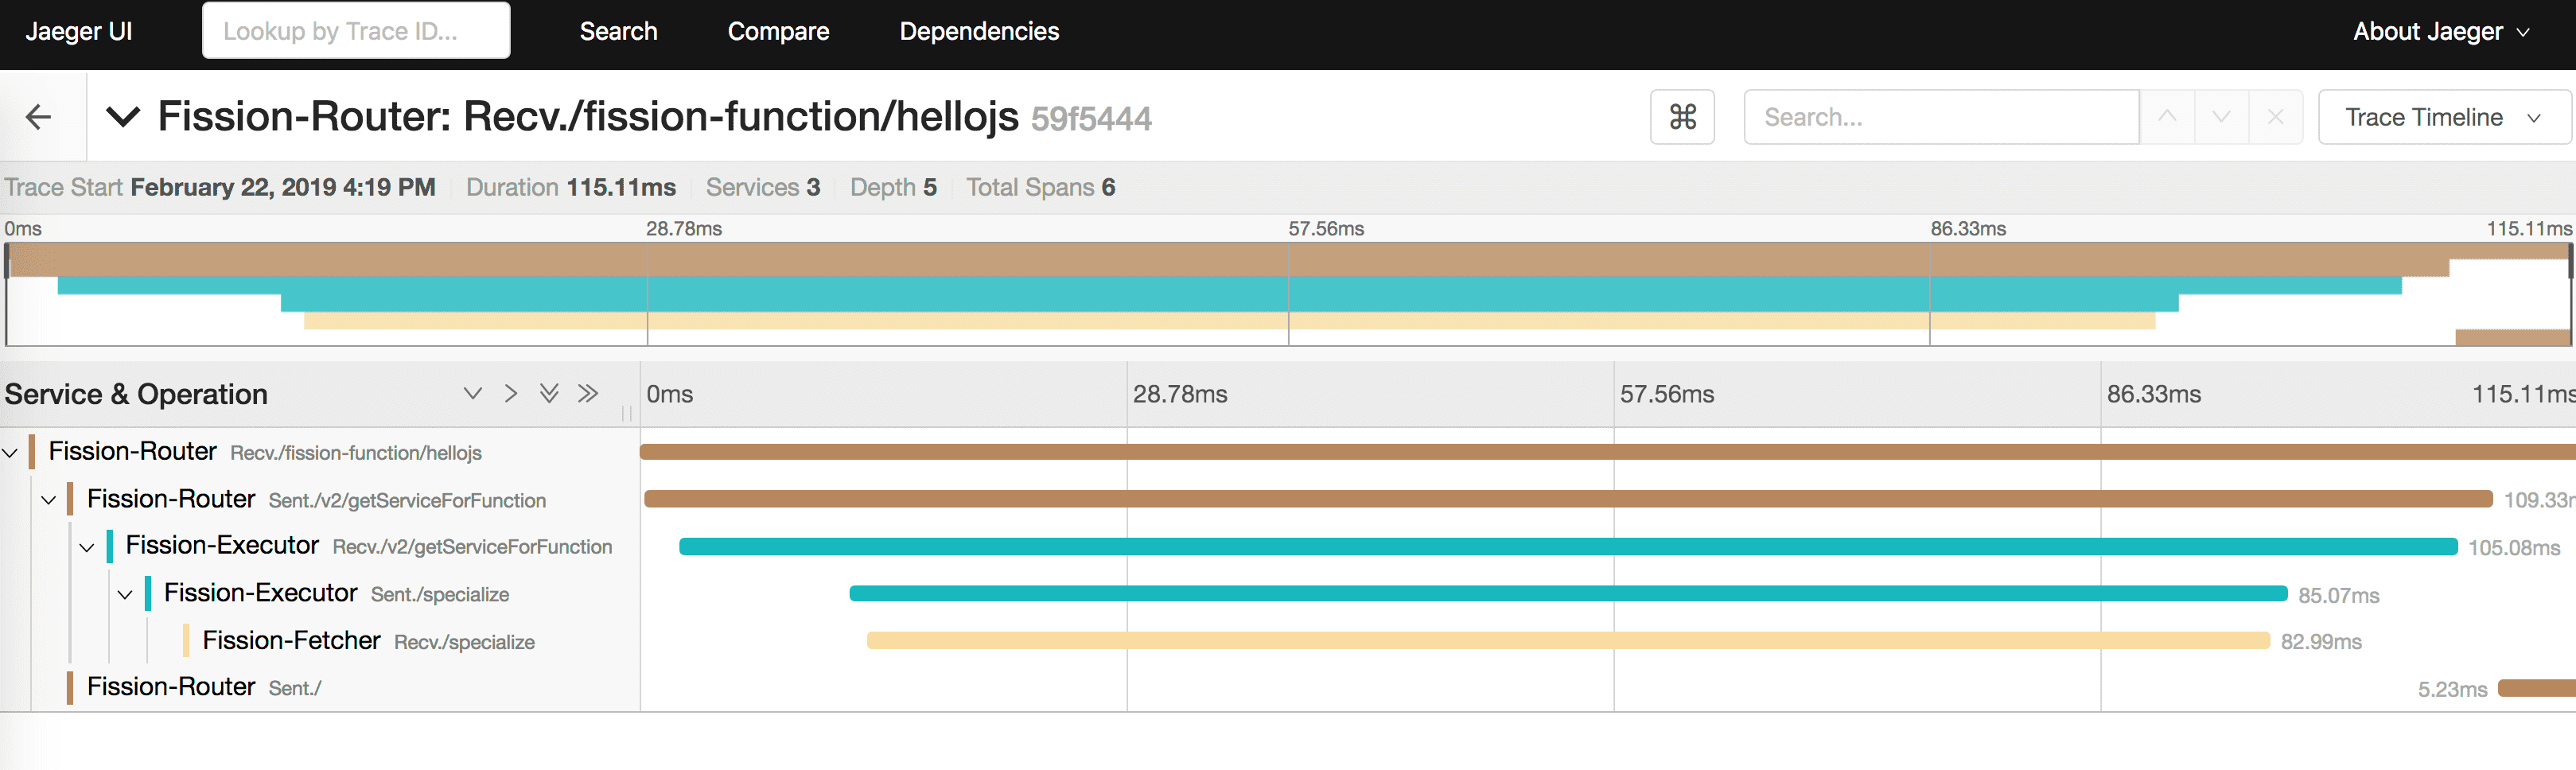
We can further drill down into the traces and spans for individual components and execution paths as shown in the following screenshot:
Controlling the Sampling rate
In a production environment, you may not want to trace all the requests but rather only trace a sample a subset of requests to reduce the amount of data that would need to be stored and processed. This can be controlled with the “sampling rate” in Jaeger - which is a number between 0-1 indicating the percentage of total requests to be sampled for tracing. You can use the variable in Helm charts to control the sampling rate (Or with TRACING_SAMPLING_RATE variable if you are using plain YAMLs)
traceSamplingRate: 0.75
Try it out!
Open tracing enables developers and operations teams to gather data about important performance and usability metrics of serverless applications. This becomes even more relevant for use cases with highly distributed functions and complex systems. Try out the OpenTracing in Fission and hit us up on Slack if you have any questions or queries.
Author: